gperftools之heap profile
源文件leak.cc:
#include <stdlib.h>
int main() {
    const int array_count = 99;
    int* p = new int[array_count];
    return 0;
}
对整个程序Profile
1 动态链接
heap profiler需要-ltcmalloc:
g++ -g leak.cc -o leak -L./gperftools/libs -ltcmalloc -Wl,-rpath=/root/gperftools/gperftools/libs
加上-g参数可以打印出行号等更多的调试信息
定义环境变量HEAPCHECK,执行:
env HEAPCHECK=normal ./leak
输出结果会显示内存泄露情况,同时提示pprof命令;
定义环境变量HEAPPROFILE(heap profile导出文件名称),执行:
env HEAPPROFILE=d.prof ./leak
会将内存信息写入d.prof.0001.heap文件;
env HEAPPROFILE=d.prof HEAPCHECK=normal ./leak
输出结果会显示内存泄露情况,且将内存信息写入d.prof.0001.heap文件;
2 运行时LD_PRELOAD加载
编译:
g++ -g leak.cc -o leak
执行命令:
env LD_PRELOAD="/root/gperftools/gperftools/libs/libtcmalloc.so" HEAPCHECK=normal HEAPPROFILE=n.prof ./leak
对部分代码Profile
源代码leak2.cc:
#include <stdlib.h>
#include "heap-profiler.h"

void f()
{
    HeapProfilerStart("leak.prof");
    double* d = new double[1024 * 1028 * 19];
    HeapProfilerStop();
}

int main() {
    f();
    const int array_count = 1024 * 1024 * 5;
    int* p = new int[array_count];
    return 0;
}
静态链接-ltcmalloc:
g++ -g leak2.cc -o leak -I./gperftools/src/gperftools -Wl,-Bstatic -ltcmalloc -Wl,-Bdynamic -lpthread
heap profiler在满足以下任一条件时,将heap使用快照保存到磁盘文件:
- 程序已分配了HEAP_PROFILE_ALLOCATION_INTERVAL字节内存,默认1GB;
- 高水位内存使用标记增加了HEAP_PROFILE_INUSE_INTERVAL字节,默认100MB;
- 时间已过HEAP_PROFILE_TIME_INTERVAL秒,默认值:inactive;
- 显示调用HeapProfilerDump;
考虑如下代码leak3.cc,编译后直接执行是不会生成快照文件的,因为以上条件均不满足,取消HeapProfilerDump的注释,再次执行就可以生成快照文件了。
#include <stdlib.h>
#include "heap-profiler.h"

void f()
{
    double* d = new double[1024 * 1028 * 2];
    //HeapProfilerDump("reason1");
}

int main() {
    HeapProfilerStart("leak.prof");
    f();
    const int array_count = 1024 * 1024 * 5;
    int* p = new int[array_count];
    //HeapProfilerDump("reason2");
    HeapProfilerStop();
    return 0;
}
pprof查看profile结果
根据提示执行命令:
heap profiler:
pprof ./leak "d.prof.0001.heap" --pdf > d.pdf
pprof ./leak "d.prof.0001.heap" --text
heap checker:
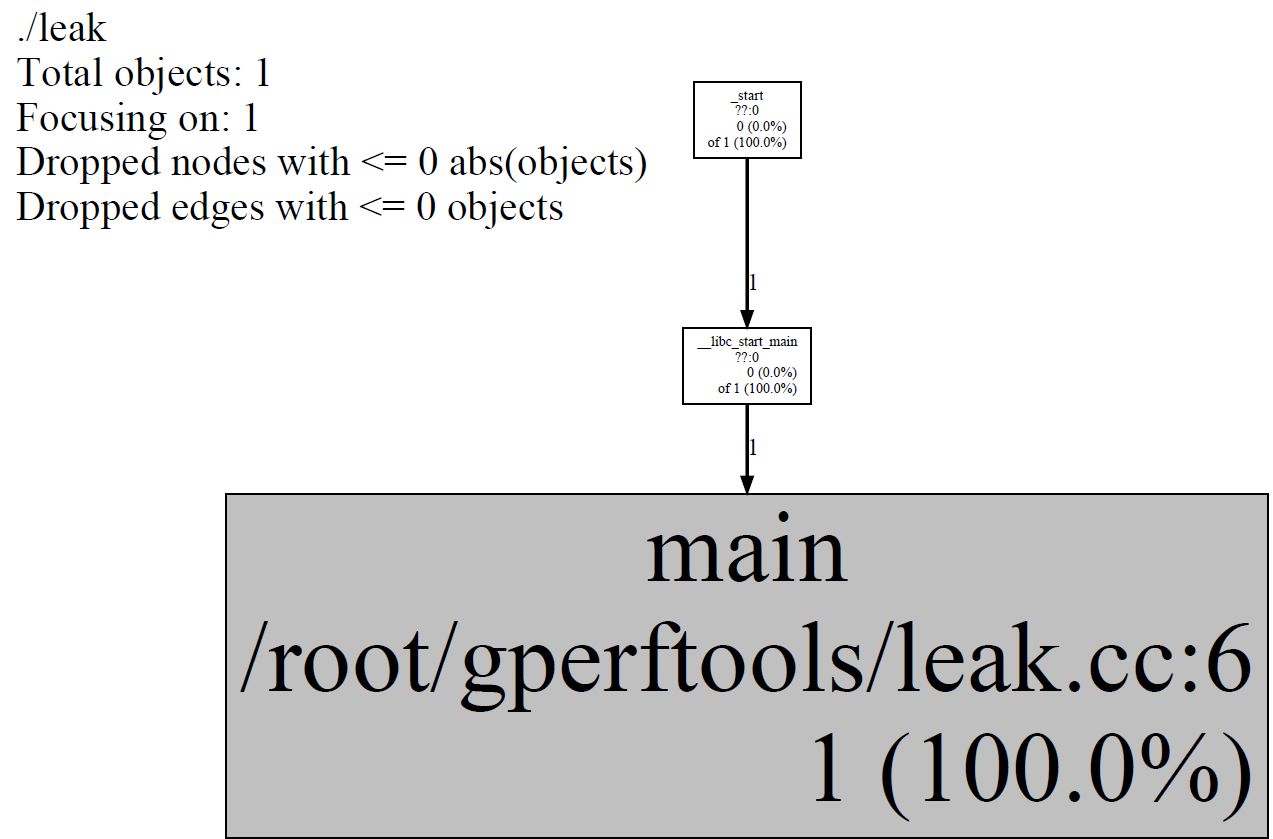
pprof ./leak "/tmp/leak.15356.main-end.heap" --inuse_objects --lines --heapcheck --edgefraction=1e-10 --nodefraction=1e-10 --pdf > d.pdf
pprof ./leak "d.prof.0001.heap" --inuse_objects --lines --heapcheck --edgefraction=1e-10 --nodefraction=1e-10 --pdf > d.pdf
pprof ./leak "/tmp/leak.15700.main-end.heap" --inuse_objects --lines --heapcheck --edgefraction=1e-10 --nodefraction=1e-10 --pdf > n.pdf
pprof ./leak "n.prof.0001.heap" --inuse_objects --lines --heapcheck --edgefraction=1e-10 --nodefraction=1e-10 --pdf > n.pdf
结果如下:
转载请注明来源,欢迎对文章中的引用来源进行考证,欢迎指出任何有错误或不够清晰的表达。可以在下面评论区评论,也可以邮件至yj.mapple@gmail.com
文章标题:gperftools之heap profile
文章字数:587
本文作者:melonshell
发布时间:2019-09-14, 23:36:27
最后更新:2019-10-30, 08:05:53
原始链接:http://melonshell.github.io/2019/09/14/tool3_gperftools2/版权声明: "署名-非商用-相同方式共享 4.0" 转载请保留原文链接及作者。

